A Friday night turned into a weekend-long benchmark marathon with 14,000+ questions per model
TL;DR
I ran comprehensive benchmarks on 19 model configurations across full MMLU (14,042 questions) and GSM8K (1,319 questions) datasets. The biggest surprise: FP16 models are often faster than quantized versions despite being larger, because quantized models generate more tokens through extended “thinking” patterns. Qwen3-30b quantized at FP16 was more than 2x the speed of the the 4 bit quantization. The fastest model by time-to-answer (vLLM AWQ at 0.030s) has the slowest tokens-per-second (66.9 tok/s), while the fastest token generator (Mistral-7B at 310.6 tok/s) takes more than twice as long to answer. This tok/s vs time-to-answer paradox fundamentally changes how we should evaluate model performance for real-world applications. Note that vLLM AWQ Qwen3 VL generally responds at ~240 tokens per second on longer answers but here it only achieved ~67 tokens per second because it returned 2 tokens. Yes, 2 tokens. As a thinking model, It simply answered the question.
It’s Friday night in January, the temperature outside has dropped to that special kind of cold that makes your furnace work overtime, and I’m staring at my workstation thinking about the electricity bill. The NVIDIA GPUs in the basement double as space heaters. Running them continuously for a weekend of benchmarking will generate roughly the same heat output as 30 pet rabbits (at least that’s the comparison Grok gave me - always the most entertaining answers) while simultaneously producing something useful: actual data about local LLM performance. Side note - heating with GPU’s have the advantage that the byproduct is tokens - perhaps as many as 20 million tokens per day. Grok tells me the byproduct of 30 pet rabbits weighs about 20 lbs and has a distinct odor necessitating its daily removal.
This is how I justify these experiments to myself. (And entertain myself by asking Grok for commentary. Yeah, Elon spends a gigawatt so I can make rabbit analogies.)
The local LLM ecosystem has exploded over the past year. We’ve got Ollama making deployment trivially easy, vLLM pushing the boundaries of inference speed, and a seemingly endless parade of new models claiming to be better, faster, or more efficient than what came before. But the benchmarks published alongside these releases are almost always on curated subsets—a hundred questions here, a few hundred there. What happens when you throw the full weight of established benchmarks at these models?
I decided to find out. Over the course of a weekend, I ran 19 different model configurations through the complete MMLU benchmark (14,042 questions across 57 subjects) and the full GSM8K mathematical reasoning benchmark (1,319 grade-school math word problems). That’s almost 300,000 LLM queries. 600,000 if you take into account that I logged the data incorrectly the first time through. No sampling, no shortcuts, no “representative subsets.” Every single question, every single model.
The results challenged several assumptions I’d been carrying around about how quantization, model size, and inference engines affect real-world performance.
The Test Rig
My benchmark server is built around an Intel Ultra 7 processor paired with an NVIDIA RTX 6000 Pro Blackwell GPU. The system runs Ollama for GGUF models and vLLM for AWQ-quantized models. Both services were configured identically: temperature 0.0 for near deterministic outputs, maximum context length, no system prompts beyond what the benchmark required.
The benchmarking scripts themselves were straightforward Python, running single-threaded to ensure consistent timing measurements. Each question was sent, the response recorded, and timing captured at millisecond precision. For MMLU, I measured the time from request to complete response. For GSM8K, which requires chain-of-thought reasoning and therefore generates significantly more tokens, I captured both total time and tokens-per-second metrics.
Why single-threaded? Because I wanted to understand the latency characteristics of each model, not their throughput under parallel load. In many real-world applications—chatbots, coding assistants, interactive tools—you care about how long a user waits for each response, not how many requests you can batch together. I did perform a final set of runs at 4x and 16x parallelism on vllm to show what production throughput would actually look like.
The First Surprise: FP16 Is Faster than Q4
Going into this benchmark, I expected quantized models to be faster than their full-precision counterparts. That’s the whole pitch for quantization: trade some accuracy for speed and memory efficiency. A Q4 model should be roughly twice as fast as Q8, and Q8 should be faster than FP16. Right?
The data told a different story.
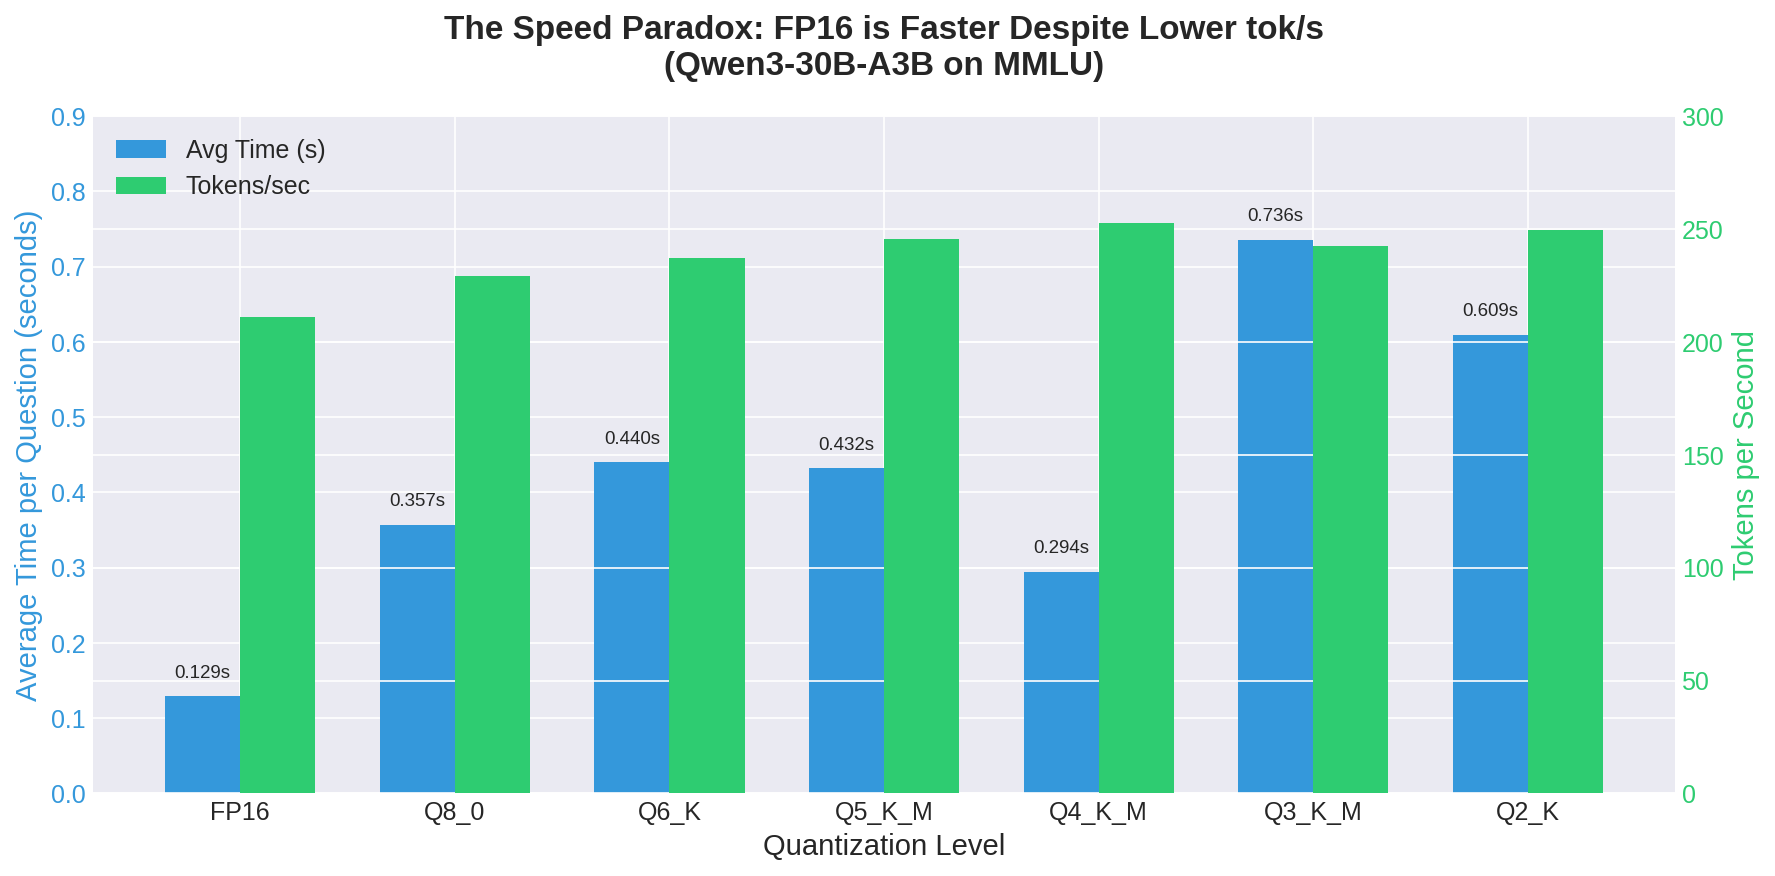
Looking at the Qwen3-30B-A3B model family across seven quantization levels, from Q2_K (the most aggressive quantization) to FP16 (full precision), the FP16 model wasn’t just competitive—it was the fastest by a significant margin:
| Quantization | MMLU Accuracy | Avg Time/Question | Tokens/sec |
|---|---|---|---|
| FP16 | 78.7% | 0.129s | 210.9 |
| Q8_0 | 71.1% | 0.357s | 229.4 |
| Q6_K | 71.8% | 0.440s | 237.2 |
| Q5_K_M | 68.3% | 0.432s | 245.4 |
| Q4_K_M | 69.1% | 0.294s | 252.7 |
| Q3_K_M | 61.0% | 0.736s | 242.3 |
| Q2_K | 57.4% | 0.609s | 249.4 |
The FP16 model answers questions in 0.129 seconds on average. The Q2_K model—which uses less than a quarter of the memory—takes 0.609 seconds. That’s not a small difference. That’s the FP16 model being 4.7 times faster than the most aggressively quantized version.
Look at the tokens-per-second column. The quantized models are generating tokens faster—Q4_K_M hits 252.7 tok/s compared to FP16’s 210.9 tok/s. But they’re taking longer to answer. This can only mean one thing: the quantized models are generating more tokens per response. Another way of looking at this is that tokens generated by full precision models are more valuable than tokens from quantized models.
The Thinking Model Problem
Modern instruction-tuned models, especially those trained with techniques like RLHF and DPO, have learned that showing their work leads to better outcomes. They don’t just output “A”—they reason through the problem, consider alternatives, sometimes second-guess themselves, then arrive at an answer. This is great for complex tasks where you want transparency into the model’s reasoning process.
But for a multiple-choice benchmark where the correct answer is literally just a single letter?
Quantization degrades a model’s ability to know when to stop. The FP16 model has learned, through all those floating-point weights, exactly when a question is simple enough to just output the answer directly. The quantized versions have lost some of that nuance. They’re more likely to engage in extended reasoning even when it’s unnecessary, generating hundreds of tokens before finally committing to a response.
The standard deviation data makes this stark. The FP16 model has a time standard deviation of 0.086 seconds—most responses cluster tightly around the mean. The Q3_K_M model has a standard deviation of 8.63 seconds, more than ten times its mean response time. Some questions are answered in a fraction of a second; others trigger extended reasoning loops that run for half a minute or more.
This creates a reliability problem beyond just speed. In a production system, you can’t tell users “this will take between 0.1 and 30 seconds, depending on whether the model decides to think really hard about your simple question.”
The vLLM Paradox
The surprises continued when I compared inference engines. vLLM, running the Qwen3-VL-30B model with AWQ 4-bit quantization, produced these numbers:
- Average time per question: 0.030 seconds
- Tokens per second: 66.9
- MMLU Accuracy: 78.9%
Compare that to Ollama running the same model family at FP16:
- Average time per question: 0.129 seconds
- Tokens per second: 210.9
- MMLU Accuracy: 78.7%
The vLLM model is 4.3 times faster by wall-clock time but generates tokens at 3.2 times slower rate. How is that possible?
vLLM’s AWQ quantization, combined with its optimized inference engine, produces dramatically more concise responses. Where the Ollama model might generate 25-30 tokens before arriving at an answer, the vLLM model averages around 2-3 tokens. It’s not faster because it processes tokens more quickly—it’s faster because it wastes fewer tokens on unnecessary elaboration. Also, the token per second number at low token counts is low for any model, those first few tokens absorb the overhead of question startup latency.
For MMLU-style benchmarks, this is ideal. For applications where you want detailed explanations, it might be a problem. The same model, running through different inference engines with different quantization methods, exhibits fundamentally different behavior.
This reveals something important about benchmarking: tokens-per-second is not a measure of how fast your model will answer questions. It’s a measure of how quickly your model can generate tokens once it decides to generate them. The decision of how many tokens to generate is separate from the speed of generation, and both matter for user experience.
What This Means for Choosing Models
If you’re optimizing for latency—getting answers to users as quickly as possible—tokens-per-second benchmarks will mislead you. A model that generates 300 tokens per second but needs 100 tokens to answer is slower than a model that generates 100 tokens per second but needs only 10 tokens to answer.
For interactive applications, measure what users actually experience: wall-clock time from question to complete answer. The best-performing model by this metric in my tests was vLLM with AWQ quantization at 0.030 seconds per MMLU question—not because it’s the fastest token generator, but because it’s the most concise.
For batch processing where you’re paying per token or have fixed GPU time, tokens-per-second matters more. If you’re processing thousands of documents overnight, you want maximum throughput regardless of individual response latency.
And if you’re running on memory-constrained hardware where FP16 simply won’t fit, the quantization accuracy loss is real—7.6 percentage points between FP16 and Q8_0 on MMLU—but the speed penalty is equally real. Don’t assume that smaller models are automatically faster.
The space heater keeps running. The numbers keep accumulating. In Part 2, I’ll dig deeper into the quantization ladder and explore why Q6_K mysteriously outperforms Q8_0 on accuracy despite using fewer bits.
This is Part 1 of a 5-part series on local LLM benchmarking. Part 2: The Quantization Ladder explores the non-monotonic relationship between bit depth and accuracy.